4. Input and Output
A good relationship depends on good communication. In this chapter you learn how to communicate with Python. Of course, communicating is a two-way street: input and output. Generally, when you have Python perform some task, you need to feed it information—input. When it is done with that task, it reports back to you the results of its calculations—output.
There are two venues for input that concern us: the computer keyboard and the input data file. Similarly, there are two venues for output: the computer screen and the output data file. We start with input from the keyboard and output to the computer screen. Then we deal with data file input and output—or “io.”
4.1. Keyboard input
Many computer programs need input from the user. In Scripting Example 1, the program needed the distance traveled as an input in order to determine the duration of the trip and the cost of the gasoline. As you might like to use this same script to determine the cost of several different trips, it would be useful if the program requested that input when it was run from the IPython shell.
Python has a function called raw_input (renamed input in Python 3) for getting input from the user and assigning it a variable name. It has the form
strname = raw_input("prompt to user")
When the raw_input statement is executed, it prints the text in the quotes to the computer screen and waits for input from the user. The user types a string of characters and presses the return key. The raw_input function then assigns that string to the variable name on the right of the assignment operator =.
Let’s try it out this snippet of code in the IPython shell.
In [1]: distance = raw_input("Input distance of trip in miles: ")

Input distance of trip in miles:
Python prints out the string argument of the raw_input function and waits for a response from you. Let’s go ahead and type 450 for “450 miles” and press return. Now type the variable name distance to see its value
In [2]: distance
Out[2]: u'450'
The value of the distance is 450 as expected, but it is a string (the u stands for “unicode” which refers to the string coding system Python uses). Because we want to use 450 as a number and not a distance, we need to convert it from a string to a number. We can do that with the eval function by writing
In [3]: distance = eval(distance)

In [4]: distance
Out[4]: 450
The eval function has converted distance to an integer. This is fine and we are ready to move on. However, we might prefer that distance be a float instead of an integer. There are two ways to do this. We could assume the user is very smart and will type “450.” instead of “450”, which will cause distance to be a float when eval does the conversion. That is, the number 450 is dynamically typed to be a float or an integer depending on whether or not the user uses a decimal point. Alternatively, we could use the function float in place of eval, which would ensure that distance is a floating point variable. Thus, our code would look like this (including the user response):
In [5]: distance = raw_input("Input distance of trip in miles: ")

Input distance of trip in miles: 450

In [5]: distance
Out[5]: u'450'

In [7]: distance = float(distance)

In [8]: distance
Out[8]: 450.0
Now let’s incorporate what we have learned into the code we wrote for Scripting Example 1
1 2 3 4 5 6 7 8 9 10 11 12 13 | # Calculates time, gallons of gas used, and cost of gasoline for
# a trip
distance = raw_input("Input distance of trip in miles: ")
distance = float(distance)
mpg = 30. # car mileage
speed = 60. # average speed
costPerGallon = 4.10 # price of gas
time = distance/speed
gallons = distance/mpg
cost = gallons*costPerGallon
|
Lines 4 and 5 can be combined into a single line, which is a little more efficient:
distance = float(raw_input("Input distance of trip in miles: "))
Whether you use float or int or eval depends on whether you want a float, an integer, or a dynamically typed variable. In this program, it doesn’t matter.
Now you can simply run the program and then type time, gallons, and cost to view the results of the calculations done by the program.
Before moving on to output, we note that sometimes you may want string input rather that numerical input. For example, you might want the user to input their name, in which case you would simply use the raw_input function without converting its output.
4.2. Screen output
It would be much more convenient if the program in the previous section would simply write its output to the computer screen, instead of requiring the user to type time, gallons, and cost to view the results. Fortunately, this can be accomplished very simply using Python’s print function. For example, simply including the statement print(time, gallons, cost) after line 12, running the program would give the following result:
In [1]: run myTripIO.py

What is the distance of your trip in miles? 450
(7.5, 15.0, 61.49999999999999)
The program prints out the results as a tuple of time (in hours), gasoline used (in gallons), and cost (in dollars). Of course, the program doesn’t give the user a clue as to which quantity is which. The user has to know.
4.2.1. Formatting output with str.format()
We can clean up the output of the example above and make it considerably more user friendly. The program below demonstrates how to do this.
1 2 3 4 5 6 7 8 9 10 11 12 13 14 15 16 17 | # Calculates time, gallons of gas used, and cost of gasoline for
# a trip
distance = float(raw_input("Input distance of trip in miles: "))
mpg = 30. # car mileage
speed = 60. # average speed
costPerGallon = 4.10 # price of gas
time = distance/speed
gallons = distance/mpg
cost = gallons*costPerGallon
print("\nDuration of trip = {0:0.1f} hours".format(time))
print("Gasoline used = {0:0.1f} gallons (@ {1:0.0f} mpg)"
.format(gallons, mpg))
print("Cost of gasoline = ${0:0.2f} (@ ${1:0.2f}/gallon)"
.format(cost, costPerGallon))
|
The final two print function calls in this script are continued on a second line in order to improve readability.
Running this program, with the distance provided by the user, gives
In [9]: run myTripNiceIO.py

What is the trip distance in miles? 450

Duration of trip = 7.5 hours
Gasoline used = 15.0 gallons (@ 30 mpg)
Cost of gasoline = $61.50 (@ $4.10/gallon)
Now the output is presented in a way that is immediately understandable to the user. Moreover, the numerical output is formatted with an appropriate number of digits to the right of the decimal point. For good measure, we also included the assumed mileage (30 mpg) and the cost of the gasoline. All of this is controlled by the str.format() function within the print function.
The argument of the print function is of the form str.format() where str is a string that contains text that is written to be the screen, as well as certain format specifiers contained in curly braces {}. The format function contains the list of variables that are to be printed.
- The
\nat the start of the string in the- The positions of the curly braces determine where the variables in the
formatfunction at the end of the statement are printed.- The format string inside the curly braces specifies how each variable in the
formatfunction is printed.- The number before the colon in the format string specifies which variable in the list in the
formatfunction is printed. Remember, Python is zero-indexed, so 0 means the first variable is printed, 1 means the second variable, etc.- The zero after the colon specifies the minimum number of spaces reserved for printing out the variable in the format function. A zero means that only as many spaces as needed will be used.
- The number after the period specifies the number of digits to the right of the decimal point that will be printed:
1fortimeandgallonsand2forcost.- The
fspecifies that a number with a fixed number of decimal points. If thefformat specifier is replaced withe, then the number is printed out in exponential format (scientific notation).
In addition to f and e format types, there are two more that are commonly used: d for integers (digits) and s for strings. There are, in fact, many more formatting possibilities. Python has a whole “Format Specification Mini-Language” that is documented at http://docs.python.org/library/string.html#formatspec. It’s very flexible but arcane. You might find it simplest to look at the “Format examples” section further down the same web page.
The program below illustrates most of the formatting you will need for writing a few variables, be they strings, integers, or floats, to screen or to data files (which we discuss in the next section).
string1 = "How"
string2 = "are you my friend?"
int1 = 34
int2 = 942885
float1 = -3.0
float2 = 3.141592653589793e-14

print(' ***')
print(string1)
print(string1 + ' ' + string2)
print(' 1. {} {}'.format(string1, string2))
print(' 2. {0:s} {1:s}'.format(string1, string2))
print(' 3. {0:s} {0:s} {1:s} - {0:s} {1:s}'
      .format(string1, string2))
print(' 4. {0:10s}{1:5s}'
      .format(string1, string2))
print(' ***')
print(int1, int2)
print(' 6. {0:d} {1:d}'.format(int1, int2))
print(' 7. {0:8d} {1:10d}'.format(int1, int2))
print(' ***')
print(' 8. {0:0.3f}'.format(float1))
print(' 9. {0:6.3f}'.format(float1))
print('10. {0:8.3f}'.format(float1))
print(2*'11. {0:8.3f}'.format(float1))
print(' ***')
print('12. {0:0.3e}'.format(float2))
print('13. {0:10.3e}'.format(float2))
print('14. {0:10.3f}'.format(float2))
print(' ***')
print('15. 12345678901234567890')
print('16. {0:s}--{1:8d},{2:10.3e}'
      .format(string2, int1, float2))
Here is the output:
1 2 3 4 5 6 7 8 9 10 11 12 13 14 15 16 17 18 19 20 21 22 23 | ***
How
How are you my friend?
1. How are you my friend?
2. How are you my friend?
3. How How are you my friend? - How are you my friend?
4. How are you my friend?
***
(34, 942885)
6. 34 942885
7. 34 942885
***
8. -3.000
9. -3.000
10. -3.000
11. -3.00011. -3.000
***
12. 3.142e-14
13. 3.142e-14
14. 0.000
***
15. 12345678901234567890
16. are you my friend?-- 34, 3.142e-14
|
Successive empty brackets {} like those that appear in the statement above print(' 1. {} {}'.format(string1, string2)) are numbered consecutively starting at 0 and will print out whatever variables appear inside the format() method using their default format.
Finally, note that the code starting on lines 14 and 16 each are split into two lines. We have done this so that the lines fit on the page without running off the edge. Python allows you to break lines up like this to improve readability.
4.2.2. Printing arrays
Formatting NumPy arrays for printing requires another approach. As an example, let’s create an array and then format it in various ways. From the IPython terminal
In [10]: a = linspace(3, 19, 7)
In [11]: print(a)
[  3.           5.66666667   8.33333333  11.
   13.66666667  16.33333333  19.        ]
Simply using the print function does print out the array, but perhaps not in the format you desire. To control the output format, you use the NumPy function set_printoptions. For example, suppose you want to see no more than two digits to the right of the decimal point. Then you simply write
In [12]: set_printoptions(precision=2)
In [13]: print(a)
[  3.     5.67   8.33  11.    13.67  16.33  19.  ]
If you want to change the number of digits to the right of the decimal point to 4, you set the keyword argument precision to 4
In [14]: set_printoptions(precision=4)
In [15]: print(a)
[  3.       5.6667   8.3333  11.      13.6667  16.3333  19.    ]
Suppose you want to use scientific notation. The method for doing it is somewhat arcane, using something called a lambda function. For now, you don’t need to understand how it works to use it. Just follow the examples shown below, which illustrate several different output formats using the print function with NumPy arrays.
In [16]: set_printoptions(
    ...: formatter={'float': lambda x: format(x, '6.2e')})

In [17]: print(a)
[3.00e+00 5.67e+00 8.33e+00 1.10e+01 1.37e+01 1.63e+01 1.90e+01]
To specify the format of the output, you use the formatter keyword argument. The first entry to the right of the curly bracket is a string that can be 'float', as it is above, or 'int', or 'str', or a number of other data types that you can look up in the online NumPy documentation. The only other thing you should change is the format specifier string. In the above example, it is '6.2e', specifying that Python should allocate at least 6 spaces, with 2 digits to the right of the decimal point in scientific (exponential) notation. For fixed width floats with 3 digits to the right of the decimal point, use the f in place of the e format specifier, as follows
In [18]: set_printoptions(
    ...: formatter={'float': lambda x: format(x, '6.3f')})
In [19]: print(a)
[ 3.000  5.667  8.333 11.000 13.667 16.333 19.000]
To return to the default format, type the following
In [20]: set_printoptions(precision=8)
In [21]: print(a)
[  3.           5.66666667   8.33333333  11.
   13.66666667  16.33333333  19.        ]
The set_printoptions is a NumPy function, so if you use it in a script or program, you should call it by writing np.set_printoptions.
4.3. File input
4.3.1. Reading data from a text file
Often you would like to analyze data that you have stored in a text file. Consider, for example, the data file below for an experiment measuring the free fall of a mass.
1 2 3 4 5 6 7 8 9 10 11 12 13 14 15 16 17 18 | Data for falling mass experiment
Date: 16-Aug-2013
Data taken by Lauren and John
data point time (sec) height (mm) uncertainty (mm)
0 0.0 180 3.5
1 0.5 182 4.5
2 1.0 178 4.0
3 1.5 165 5.5
4 2.0 160 2.5
5 2.5 148 3.0
6 3.0 136 2.5
7 3.5 120 3.0
8 4.0 99 4.0
9 4.5 83 2.5
10 5.0 55 3.6
11 5.5 35 1.75
12 6.0 5 0.75
|
We would like to read these data into a Python program, associating the data in each column with an appropriately named array. While there are a multitude of ways to do this in Python, the simplest by far is to use the NumPy loadtxt function, whose use we illustrate here. Suppose that the name of the text file is MyData.txt. Then we can read the data into four different arrays with the following statement
In [1]: dataPt, time, height, error = np.loadtxt("MyData.txt",
      skiprows=5 , unpack=True)
In this case, the loadtxt function takes three arguments: the first is a string that is the name of the file to be read, the second tells loadtxt to skip the first 5 lines at the top of file, sometimes called the header, and the third tells loadtxt to output the data (unpack the data) so that it can be directly read into arrays. loadtxt reads however many columns of data are present in the text file to the array names listed to the left of the “=” sign. The names labeling the columns in the text file are not used, but you are free to choose the same or similar names, of course, as long as they are legal array names. By the way, for the above loadtxt call to work, the file MyData.txt should be in the current working directory of the IPython shell. Otherwise, you need to specify the directory path with the file name.
It is critically important that the data file be a text file. It cannot be a MSWord file, for example, or an Excel file, or anything other than a plain text file. Such files can be created by a text editor programs like Notepad and Notepad++ (for a PC) or TextEdit and TextWrangler (for a Mac). They can also be created by MSWord and Excel provided you explicitly save the files as text files. Beware: You should exit any text file you make and save it with a program that allows you to save the text file using UNIX-type formatting, which uses a line feed (LF) to end a line. Some programs, like MSWord under Windows, may include a carriage return (CR) character, which can confuse loadtxt. Note that we give the file name a .txt extension, which indicates to most operating systems that this is a text file, as opposed to an Excel file, for example, which might have a .xlsx or .xls extension.
If you don’t want to read in all the columns of data, you can specify which columns to read in using the usecols key word. For example, the call
In [2]: time, height = loadtxt('MyData.txt', skiprows=5 ,
                                 usecols = (1,2), unpack=True)
reads in only columns 1 and 2; columns 0 and 3 are skipped. As a consequence, only two array names are included to the left of the “=” sign, corresponding to the two column that are read. Writing usecols = (0,2,3) would skip column 1 and read in only the data in colums 0, 2, and 3. In this case, 3 array names would need to be provided on the left hand side of the “=” sign.
One convenient feature of the loadtxt function is that it recognizes any white space as a column separator: spaces, tabs, etc.
Finally you should remember that loadtxt is a NumPy function. So if you are using it in a Python module, you must be sure to include an “import numpy as np” statement before calling “np.loadtxt”.
4.3.2. Reading data from a CSV file
Sometimes you have data stored in a spreadsheet program like Excel that you would like to read into a Python program. The Excel data sheet shown here contains the same data set we saw above in a text file.
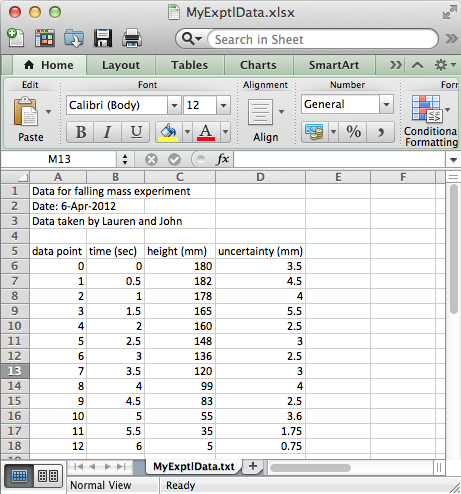
Excel data sheet
While there are a number of different approaches one can use to reading such files, one of the simplest of most robust is to save the spreadsheet as a CSV (“comma separated value”) file, a format which all common spreadsheet programs can create and read. So, if your Excel spreadsheet was called MyData.xlsx, the CSV file saved using Excel’s Save As command would by default be MyData.csv. It would look like this
1 2 3 4 5 6 7 8 9 10 11 12 13 14 15 16 17 18 | Data for falling mass experiment,,,
Date: 16-Aug-2013,,,
Data taken by Lauren and John,,,
,,,
data point,time (sec),height (mm),uncertainty (mm)
0,0,180,3.5
1,0.5,182,4.5
2,1,178,4
3,1.5,165,5.5
4,2,160,2.5
5,2.5,148,3
6,3,136,2.5
7,3.5,120,3
8,4,99,4
9,4.5,83,2.5
10,5,55,3.6
11,5.5,35,1.75
12,6,5,0.75
|
As its name suggests, the CSV file is simply a text file with the data that was formerly in spreadsheet columns now separated by commas. We can read the data in this file into a Python program using the loadtxt NumPy function once again. Here is the code
In [3]: dataPt, time, height, error = loadtxt("MyData.csv",
                      skiprows=5 , unpack=True, delimiter=',')
The form of the function is exactly the same as before except we have added the argument delimiter=',' that tells loadtxt that the columns are separated by commas instead of white space (spaces or tabs), which is the default. Once again, we set the skiprows argument to skip the header at the beginning of the file and to start reading at the first row of data. The data are output to the arrays to the right of the assignment operator = exactly as in the previous example.
4.4. File output
4.4.1. Writing data to a text file
There is a plethora of ways to write data to a data file in Python. We will stick to one very simple one that’s suitable for writing data files in text format. It uses the NumPy savetxt routine, which is the counterpart of the loadtxt routine introduced in the previous section. The general form of the routine is
savetxt(filename, array, fmt="%0.18e", delimiter=" ", newline="\n",
    header="", footer="", comments="# ")
We illustrate savetext below with a script that first creates four arrays by reading in the data file MyData.txt, as discussed in the previous section, and then writes that same data set to another file MyDataOut.txt.
1 2 3 4 5 6 7 | import numpy as np
dataPt, time, height, error = np.loadtxt("MyData.txt",
skiprows=5, unpack=True)
np.savetxt('MyDataOut.txt',
zip(dataPt, time, height, error), fmt="%12.1f")
|
The first argument of of savetxt is a string, the name of the data file to be created. Here we have chosen the name MyDataOut.txt, inserted with quotes, which designates it as a string literal. Beware, if there is already a file of that name on your computer, it will be overwritten—the old file will be destroyed and a new one will be created.
The second argument is the data array the is to be written to the data file. Because we want to write not one but four data arrays to the file, we have to package the four data arrays as one, which we do using the zip function, a Python function that combines returns a list of tuples, where the \(i^\mathrm{th}\) tuple contains the \(i^\mathrm{th}\) element from each of the arrays (or lists, or tuples) listed as its arguments. Since there are four arrays, each row will be a tuple with four entries, producing a table with four columns. Note that the first two arguments, the filename and data array, are regular arguments and thus must appear as the first and second arguments in the correct order. The remaining arguments are all keyword arguments, meaning that they are optional and can appear in any order, provided you use the keyword.
The next argument is a format string that determines how the elements of the array are displayed in the data file. The argument is optional and, if left out, is the format 0.18e, which displays numbers as 18 digit floats in exponential (scientific) notation. Here we choose a different format, 12.1f, which is a float displayed with 1 digit to the right of the decimal point and a minimum width of 12. By choosing 12, which is more digits than any of the numbers in the various arrays have, we ensure that all the columns will have the same width. It also ensures that the decimal points in column of numbers are aligned. This is evident in the data file below, MyDataOut.txt, which was produced by the above script.
 0.0          0.0        180.0          3.5
 1.0          0.5        182.0          4.5
 2.0          1.0        178.0          4.0
 3.0          1.5        165.0          5.5
 4.0          2.0        160.0          2.5
 5.0          2.5        148.0          3.0
 6.0          3.0        136.0          2.5
 7.0          3.5        120.0          3.0
 8.0          4.0         99.0          4.0
 9.0          4.5         83.0          2.5
10.0          5.0         55.0          3.6
11.0          5.5         35.0          1.8
12.0          6.0          5.0          0.8
We omitted the optional delimiter keyword argument, which leaves the delimiter as the default space.
We also omitted the optional header keyword argument, which is a string variable that allows you to write header text above the data. For example, you might want to label the data columns and also include the information that was in the header of the original data file. To do so, you just need to create a string with the information you want to include and then use the header keyword argument. The code below illustrates how to do this.
1 2 3 4 5 6 7 8 9 10 11 12 13 | import numpy as np
dataPt, time, height, error = np.loadtxt("MyData.txt",
skiprows=5, unpack=True)
info = 'Data for falling mass experiment'
info += '\nDate: 16-Aug-2013'
info += '\nData taken by Lauren and John'
info += '\n\n data point time (sec) height (mm) '
info += 'uncertainty (mm)'
np.savetxt('MyDataOut.txt',
zip(dataPt, time, height, error), header=info, fmt="%12.1f")
|
Now the data file produces has a header preceding the data. Notice that the header rows all start with a # comment character, which is the default setting for the savetxt function. This can be changed using the keyword argument comments. You can find more information about savetxt using the IPython help function or from the online NumPy documentation.
# Data for falling mass experiment
# Date: 16-Aug-2013
# Data taken by Lauren and John
#
#    data point    time (sec) height (mm)  uncertainty (mm)
         0.0          0.0        180.0          3.5
         1.0          0.5        182.0          4.5
         2.0          1.0        178.0          4.0
         3.0          1.5        165.0          5.5
         4.0          2.0        160.0          2.5
         5.0          2.5        148.0          3.0
         6.0          3.0        136.0          2.5
         7.0          3.5        120.0          3.0
         8.0          4.0         99.0          4.0
         9.0          4.5         83.0          2.5
        10.0          5.0         55.0          3.6
        11.0          5.5         35.0          1.8
        12.0          6.0          5.0          0.8
4.4.2. Writing data to a CSV file
To produce a CSV file, you would specify a comma as the delimiter. You might use the 0.1f format specifier, which leaves no extra spaces between the comma data separators, as the file is to be read by a spreadsheet program, which will determine how the numbers are displayed. The code, which could be substituted for the savetxt line in the above code reads
np.savetxt('MyDataOut.csv',
        zip(dataPt, time, height, error), fmt="%0.1f",
        delimiter=",")
and produces the following data file
0.0,0.0,180.0,3.5
1.0,0.5,182.0,4.5
2.0,1.0,178.0,4.0
3.0,1.5,165.0,5.5
4.0,2.0,160.0,2.5
5.0,2.5,148.0,3.0
6.0,3.0,136.0,2.5
7.0,3.5,120.0,3.0
8.0,4.0,99.0,4.0
9.0,4.5,83.0,2.5
10.0,5.0,55.0,3.6
11.0,5.5,35.0,1.8
12.0,6.0,5.0,0.8
This data file, with a csv extension, can be directly read into a spreadsheet program like Excel.
4.5. Exercises
Write a Python program that calculates how much money you can spend each day for lunch for the rest of the month based on today’s date and how much money you currently have in your lunch account. The program should ask you: (1) how much money you have in your account, (2) what today’s date is, and (3) how many days there are in month. The program should return your daily allowance. The results of running your program should look like this:
How much money (in dollars) in your lunch account? 118.39

What day of the month is today? 17

How many days in this month? 30

You can spend $8.46 each day for the rest of the month.
Extra: Create a dictionary (see Dictionaries) that stores the number of days in each month (forget about leap years) and have your program ask what month it is rather than the number of days in the month.
From the IPython terminal, create the following three NumPy arrays:
a = array([1, 3, 5, 7])
b = array([8, 7, 5, 4])
c = array([0, 9,-6,-8])
Now use the
zipfunction to create the objectddefined asd = zip(a, b, c)
Print
dout at the terminal prompt. What kind of object isd? Hint: It is not a NumPy array. Convertdinto a NumPy array and call that arraye. Typeeat the terminal prompt so thateis printed out on the IPython terminal. One of the elements ofeis-8. Show how to address and print out just that element ofe. Show how to address that same element ofd. What has become of the three original arraysa,b, andc, that is, how do they appear ine?Create the following data file and then write a Python script to read it into a three NumPy arrays with the variable names
f,a,dafor the frequency, amplitude, and amplitude error.Date: 2013-09-16 Data taken by Liam and Selena frequency (Hz) amplitude (mm) amp error (mm) 0.7500 13.52 0.32 1.7885 12.11 0.92 2.8269 14.27 0.73 3.8654 16.60 2.06 4.9038 22.91 1.75 5.9423 35.28 0.91 6.9808 60.99 0.99 8.0192 33.38 0.36 9.0577 17.78 2.32 10.0962 10.99 0.21 11.1346 7.47 0.48 12.1731 6.72 0.51 13.2115 4.40 0.58 14.2500 4.07 0.63
Show that you have correctly read in the data by having your script print out to your computer screen the three arrays. Format the printing so that it produces output like this:
f =
[  0.75     1.7885   2.8269   3.8654   4.9038   5.9423
   6.9808   8.0192   9.0577  10.0962  11.1346  12.1731
   13.2115  14.25  ]
a =
[ 13.52  12.11  14.27  16.6   22.91  35.28  60.99  33.38
  17.78  10.99   7.47   6.72   4.4    4.07]
da =
[ 0.32  0.92  0.73  2.06  1.75  0.91  0.99  0.36  2.32
  0.21  0.48  0.51  0.58  0.63]
Note that the array
fis displayed with four digits to the right of the decimal point while the arraysaanddaare displayed with only two. The columns of the displayed arrays need not line up as they do above.Write a script to read the data from the previous problem into three NumPy arrays with the variable names
f,a,dafor the frequency, amplitude, and amplitude error and then, in the same script, write the data out to a data file, including the header, with the data displayed in three columns, just as its displayed in the problem above. It’s ok if the header lines begin with the#comment character. Your data file should have the extension.txt.Write a script to read the data from the previous problem into three NumPy arrays with the variable names
f,a,dafor the frequency, amplitude, and amplitude error and then, in the same script, write the data out to a csv data file, without the header, to a data file with the data displayed in three columns. Use a single format specifier and set it to"%0.16e". If you have access the spreadsheet program (like MS Excel), try opening the file you have created with your Python script and verify that the arrays are displayed in three columns. Note that your csv file should have the extension.csv.